I’m using the MPAndroidChart library (3.0.0) to represent psychometric personality test results in a radar chart (AKA spider chart or cobweb chart). Since the documentation I found on this was either incomplete or obsolete, I’ll briefly document the steps I took.
I’m displaying the chart inside a ConstraintLayout. A fixed height gives satisfactory results on all tested devices.
<com.github.mikephil.charting.charts.RadarChart android:id="@+id/chart" android:layout_width="0dp" android:layout_height="360dp" android:layout_marginEnd="24dp" android:layout_marginLeft="24dp" android:layout_marginRight="24dp" android:layout_marginStart="24dp" app:layout_constraintBottom_toBottomOf="parent" app:layout_constraintLeft_toLeftOf="parent" app:layout_constraintRight_toRightOf="parent" app:layout_constraintTop_toBottomOf="@+id/textViewTitle" app:layout_constraintVertical_bias="0.0" /> |
Some fields are needed in our Fragment to hold reference to the RadarChart (and optionally a Typeface), store the variables (factors), the raw data (scores), the List of chart entries and the List of data sets to plot (only one set in this example).
private RadarChart mChart; private Typeface mTfLight; private SparseIntArray factors = new SparseIntArray(5); private SparseIntArray scores = new SparseIntArray(5); private ArrayList<RadarEntry> entries = new ArrayList<>(); private ArrayList<IRadarDataSet> dataSets = new ArrayList<>(); |
The factors (‘x-axis’) are defined in onCreate(), as well as a Typeface to be loaded from the assets directory:
@Override
public void onCreate(Bundle savedInstanceState) {
super.onCreate(savedInstanceState);
// ...
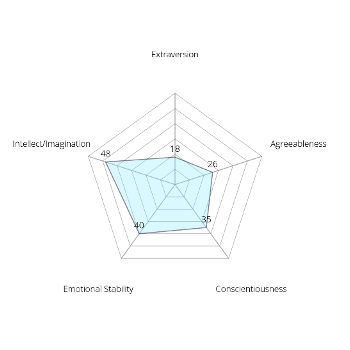
factors.append(1, R.string.extraversion);
factors.append(2, R.string.agreeableness);
factors.append(3, R.string.conscientiousness);
factors.append(4, R.string.emotional_stability);
factors.append(5, R.string.intellect_imagination);
mTfLight = Typeface.createFromAsset(mActivity.getAssets(), "OpenSans-Light.ttf");
// ...
} |
The strings will be displayed on the chart axes (the ‘x-axis’ of the chart object).
We’ll set the appearance properties of the chart in onCreateView(). We load our data the proper way, asynchronously using a Loader pattern, so we should populate the chart somewhat later in the lifecycle from onLoadFinished. Most properties should be self-explanatory. Use an IAxisValueFormatter to return a formatted String representation of the values to display.
    @Override
    public View onCreateView(LayoutInflater inflater, ViewGroup container,
                             Bundle savedInstanceState) {
        View rootView = inflater.inflate(R.layout.fragment_result, container, false);
        mChart = (RadarChart) rootView.findViewById(R.id.chart);

        XAxis xAxis = mChart.getXAxis();
        xAxis.setXOffset(0f);
        xAxis.setYOffset(0f);
        xAxis.setTypeface(mTfLight);
        xAxis.setTextSize(8f);
        xAxis.setValueFormatter(new IAxisValueFormatter() {

            private String[] mFactors = new String[]{getString(factors.get(1)), getString(factors.get(2)),
                    getString(factors.get(3)), getString(factors.get(4)), getString(factors.get(5))};

            @Override
            public String getFormattedValue(float value, AxisBase axis) {
                return mFactors[(int) value % mFactors.length];
            }

            @Override
            public int getDecimalDigits() {
                return 0;
            }
        });

        YAxis yAxis = mChart.getYAxis();
        yAxis.setAxisMinimum(0f);
        yAxis.setAxisMaximum(50f);
        yAxis.setTypeface(mTfLight);
        yAxis.setTextSize(9f);
        yAxis.setLabelCount(5, false);
        yAxis.setDrawLabels(false);

        mChart.getLegend().setEnabled(false);
        mChart.getDescription().setEnabled(false);
        mChart.animateXY(
                1400, 1400,
                Easing.EasingOption.EaseInOutQuad,
                Easing.EasingOption.EaseInOutQuad);

        // ...

        return rootView;
} |
Start the loader with restartLoader() (not initLoader()) to ensure that the cursor refreshes itself:
mActivity.getSupportLoaderManager().restartLoader(ANSWERED_ITEMS_LOADER_ID, null, this); |
Populate the data array in onLoadFinished():
    @Override
    public void onLoadFinished(Loader<Cursor> loader, Cursor cursor) {
        scores.clear();
        // while (cursor.moveToNext()) {
        //     ...
        //     scores.put(..., ...);
        // }

        // Or hardcode some test data:
        scores.append(1, 18);
        scores.append(2, 26);
        scores.append(3, 35);
        scores.append(4, 40);
        scores.append(5, 48);

        drawChart();
} |
To draw the chart, first build the list of entries. Then create a RadarDataSet from this list and add it to the list of data sets. Create a RadarData object from this list and add it to the chart.
An IValueFormatter returns a formatted string for the integer values to display.
Finally, invalidate the View to ensure that it gets redrawn when populated.
private void drawChart() { entries.clear(); for (int i = 1; i <= 5; i++) { entries.add(new RadarEntry(scores.get(i))); } RadarDataSet dataSet = new RadarDataSet(entries, ""); dataSet.setColor(R.color.colorPrimary); dataSet.setDrawFilled(true); dataSets.add(dataSet); RadarData data = new RadarData(dataSets); data.setValueTypeface(mTfLight); data.setValueTextSize(8f); data.setValueFormatter(new IValueFormatter() { @Override public String getFormattedValue(float value, Entry entry, int dataSetIndex, ViewPortHandler viewPortHandler) { return String.valueOf((int) value); } }); mChart.setData(data); mChart.invalidate(); } |
You can check out our app to see the chart in action.
For newer versions of MPAndroidChart (3.0.3) do not implement getDecimalDigits() in IAxisValueFormatter.